Speed of light from galaxies.Astronomers theorize that cold dark matter (CDM) caused the formation of galaxies. The theoretical CDM model requires an estimate of the velocity of light emitted from the galaxy. The Astronomical Journal (July, 1995) published a study of galaxy velocities. One galaxy, named A1775, is thought to be a double cluster, that is, two cluster cluster of galaxies in close proximity. Fifty-one velocity observations (in kilometers per second, km/s) from cluster A1775 are listed in the table.
22,922
|
20,210
|
21,911
|
19,225
|
18,792
|
21,993
|
23,059
|
20,785
|
22,781
|
23,303
|
22,192
|
19,462
|
19,057
|
23,017
|
20,186
|
23,292
|
19,408
|
24,909
|
19,866
|
22,891
|
23,121
|
19,673
|
23,261
|
22,796
|
22,355
|
19,807
|
23,432
|
22,625
|
22,744
|
22,426
|
19,111
|
18,933
|
22,417
|
19,595
|
23,408
|
22,809
|
19,619
|
22,738
|
18,499
|
19,130
|
23,220
|
22,647
|
22,718
|
22,779
|
19,026
|
22,513
|
19,740
|
22,682
|
19,179
|
19,404
|
22,193
|
Source: Oegerle, W.R., Hill, J.M., and Fitchett, M.J., "Observations of high dispersion clusters of galaxies: Constraints on cold dark matter." The Astronomer Journal, Vol. 110, No. 1, July 1995, p. 34 (Table 1). p. 37 (Figure 1)
1. Use a graphical method to describe the velocity distribution of galaxy cluster A1775.
The graph used in this case is histogram. The histogram is made based on frequency distribution table. The table with 7 classes is shown as follows.
The graph used in this case is histogram. The histogram is made based on frequency distribution table. The table with 7 classes is shown as follows.
Class Interval
|
Frequency
|
18,000 – 19,000
|
3
|
19,000 – 20,000
|
15
|
20,000 – 21,000
|
3
|
21,000 – 22,000
|
2
|
22,000 – 23,000
|
18
|
23,000 – 24,000
|
9
|
24,000 – 25,000
|
1
|
The histogram is shown as follows.
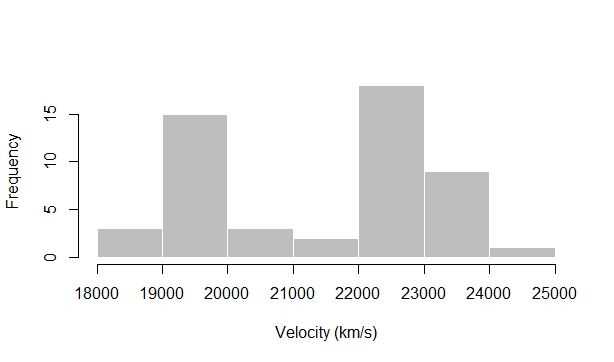
2. Examine the graph, part a. Is there evidence to support the double cluster theory? Explain.
3. Calculate numerical descriptive measures (e.g. mean and standard deviation) for galaxy velocities in cluster A1775. Depending on your answer to part b, you may need to calculate two sets of numerical descriptive measures, one for each of the clusters (say, A1775A and A1775B) within the double cluster.
Here the formula to calculate mean and standard deviation. Let x̄ and s respectively denote mean and standard deviation of sample data x, and n mean the number of data points,


Let a and b denote the data of galaxy velocities in cluster A1775A and 1775B respectively.
sa = sqrt(((18499 - 19462)2 + (18792 - 19462)2 + (18933 - 19462)2 + (19026 - 19462)2 + (19057- 19462)2 + (19111 - 19462)2 + (19130- 19462)2 + (19179- 19462)2 + (19225- 19462)2 + (19404- 19462)2 + (19408- 19462)2 + (19462- 19462)2 + (19595- 19462)2 + (19619- 19462)2 + (19673- 19462)2 + (19740- 19462)2 + (19807- 19462)2 + (19866- 19462)2 + (20186 - 19462)2 + (20210- 19462)2 + (20785 - 19462)2)/20) ≅ 532
with the same way for the data in cluster b, it can be obtained
b̄ ≅ 22838
sb ≅ 561
ā = (18499 + 18792 + 18933 + 19026 + 19057 + 19111 + 19130 + 19179 + 19225 + 19404 + 19408 + 19462 + 19595 + 19619 + 19673 + 19740 + 19807 + 19866 + 20186 + 20210 + 20785)/21 ≅ 19462
sa = sqrt(((18499 - 19462)2 + (18792 - 19462)2 + (18933 - 19462)2 + (19026 - 19462)2 + (19057- 19462)2 + (19111 - 19462)2 + (19130- 19462)2 + (19179- 19462)2 + (19225- 19462)2 + (19404- 19462)2 + (19408- 19462)2 + (19462- 19462)2 + (19595- 19462)2 + (19619- 19462)2 + (19673- 19462)2 + (19740- 19462)2 + (19807- 19462)2 + (19866- 19462)2 + (20186 - 19462)2 + (20210- 19462)2 + (20785 - 19462)2)/20) ≅ 532
with the same way for the data in cluster b, it can be obtained
sb ≅ 561
4. Suppose you observe a galaxy velocity of 20,000 km/s. Is this galaxy likely to belong to cluster A1775A or A1775B? Explain
A galaxy velocity of 20,000 km/s is likely belong to cluster A1775A because it is in interval 18,000 - 21,000 km/s which is belong to cluster A1775A.